Which hundred SKUs to fix first — and what to do with each
When a catalog business tells me "we have about a hundred bad SKUs but we don't know why" — this is the protocol that gets to a defensible action plan in five to seven hours. It catches the analysis traps that make the data lie, and only ships recommendations with the evidence to back them up.
What this could do for your organization
If you run a catalog business with more than a hundred SKUs and the tail is weak — you know it, your merchandising team knows it, your margin numbers hint at it, but nobody can point at the specific hundred items that are dragging the book down and say why — that's the shape of this protocol. Five-to-seven hours of work from "we think we have about a hundred bad SKUs" to a delivered action matrix: every one of those hundred SKUs assigned a concrete recommendation (reprice, optimize listing, bundle, fix catalog data, reposition, or discontinue), with a confidence level and the evidence behind it.
The protocol exists because the alternative is either (a) spending a month on analysis that nobody trusts by the time it lands, or (b) shipping recommendations based on what someone on the team "feels" should go — which is the same reason the tail got weak in the first place. Seven quality gates in the workflow reject any recommendation that isn't defensible: no repricing without verified unit cost, no discontinuation without a two-year margin check, no generic "investigate this" without a concrete next step.
Two things worth knowing from the live engagement. First, sales data lies about cause. The numbers looked like dire SKU-level demand problems — until a fifteen-minute client call revealed a quiet ten-percent across-the-board price increase between the two comparison periods. The protocol has a client-interview phase early, deliberately, so the analysis doesn't chase ghosts. Second, concentration matters: the top hundred SKUs accounted for fifty percent of declining-SKU revenue loss. Fixing the hundred actually moves the needle.
What your team gets back
Within a day of getting your sales data, you get a ranked top-hundred list with severity flags: DEAD (operational issues like stock-outs that your ops team should investigate before anyone does market research), STEEP (price or listing shocks, same initial response), and SLOW (the real research target). This is usually enough to confirm the problem is where you thought it was — or to surface that it's somewhere else.
In the full five-to-seven-hour run, you get the action matrix: each of the top hundred assigned one of six recommendations — reprice, optimize listing, bundle with complementary items, fix catalog data, reposition, or discontinue — with a confidence level graded against a rubric (not just a label) and the evidence underneath each one. Your category team can argue with specific SKUs, but they're arguing with evidence, not "I think this one should stay."
The first engagement is the run: I apply the protocol to your catalog data and return the action matrix. You also get a documented version of the protocol itself — phase structure, clustering rules, quality gates, the adversarial checks — so your merchandising team can either rerun it themselves on next quarter's data, or re-engage me to run it when the next batch drops. The protocol is the durable asset.
How I did it
Most catalog businesses have a tail of product SKUs they suspect are underperforming — slow sellers, weak margins, catalog clutter, "we're carrying dead wood but we don't know which items." The question isn't whether underperformers exist. The question is which ones, why, and what to do about each one — without spending a month on analysis or shipping recommendations with no evidence behind them. I built a protocol that takes a catalog business from "we think we have about a hundred bad SKUs" to a delivered action matrix — every SKU assigned a concrete recommendation with a confidence level — in five to seven hours of work.
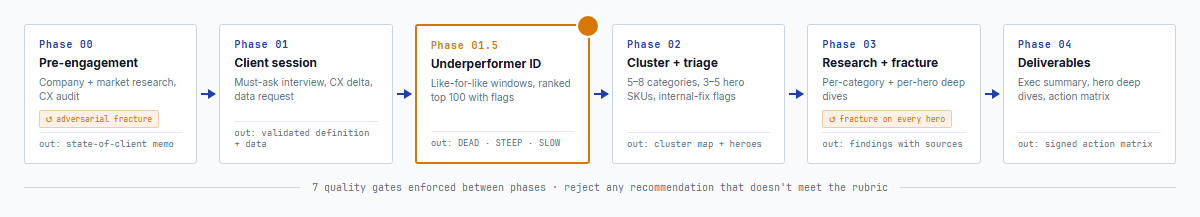
The protocol runs in six phases. Pre-engagement research and a CX audit happen before the first client call. A client session validates the data. A ranking phase produces the top-hundred list. A clustering phase groups them into patterns. Deep research runs per category and per hero SKU, with adversarial fracture at each step. A deliverables phase packages the action matrix. Every hand-off has a quality gate.
The first step is digging into the sales data to tease out the actual underperformers. That means forcing like-for-like time windows before any ranking is trusted — matching periods on both sides, accounting for seasonality.
like-for-like
With the windows fixed, every declining SKU gets a severity flag. DEAD — went from real volume to zero, usually an operational issue (stock-out, delisting, supplier change) that should be investigated internally before market research touches it. STEEP — dropped more than eighty percent, usually a listing or price shock, same initial response. SLOW — dropped twenty-to-eighty percent, genuine demand or competition shift, the deepest research target. Top hundred, sorted by revenue impact, with a concentration check. On a recent engagement, the top hundred accounted for fifty percent of total declining-SKU revenue loss. Fixing those hundred moves the needle.
Fixing those hundred moves the needle.
Full tail · £ 296 k
Naive approach to the research phase: one deep market-research query per SKU. A hundred SKUs, a hundred cold-start queries, twenty hours of AI time, and shallow results because each query has no category context and no peer comparisons. Protocol: cluster the hundred into five-to-eight categories, run one deep query per cluster, pick three-to-five hero SKUs for per-unit deep dives. Same ground covered, a fraction of the time, higher quality — each query has room to actually think.
On a recent engagement the top-line numbers looked dire — a twenty-one percent drop in units, fourteen percent in revenue, over a hundred thousand pounds sterling lighter year over year. Analysis could have spent a week building a case for SKU-specific demand problems. Fifteen minutes into the Phase 1 client interview, the real cause surfaced: the client had quietly raised prices ten percent across the board between the two periods. The data was showing price-elasticity, not SKU weakness. The protocol is built around this kind of beat. The data lies about cause until you talk to the client.
The deliverable is an action matrix. Every SKU in the top hundred gets one of six recommendations — reprice, optimize the listing, bundle with complementary items, fix catalog data, reposition, or discontinue — plus a confidence level graded against a rubric, not just a label. Seven quality gates reject any recommendation that fails: no repricing without verified unit cost, no discontinuation without a two-year margin and catalog-completeness check, no generic "investigate" without a concrete next step. What ships is defensible.
The reusable part is the protocol itself. Any catalog business — hardware, niche apparel, specialty food, specialty auto parts, industrial distributor, home-and-garden — with a web presence and two comparable time windows of sales data can be run through it. The output is the same shape every time: a ranked top-hundred, a clustered research pass, a hero-level deep dive, an action matrix where every recommendation is backed by evidence.
If you run a catalog business and you know the tail is weak but can't pinpoint which SKUs or why, drop me a line. I can point the protocol at your catalog and come back with a ranked list and flags within a day.
Related projects
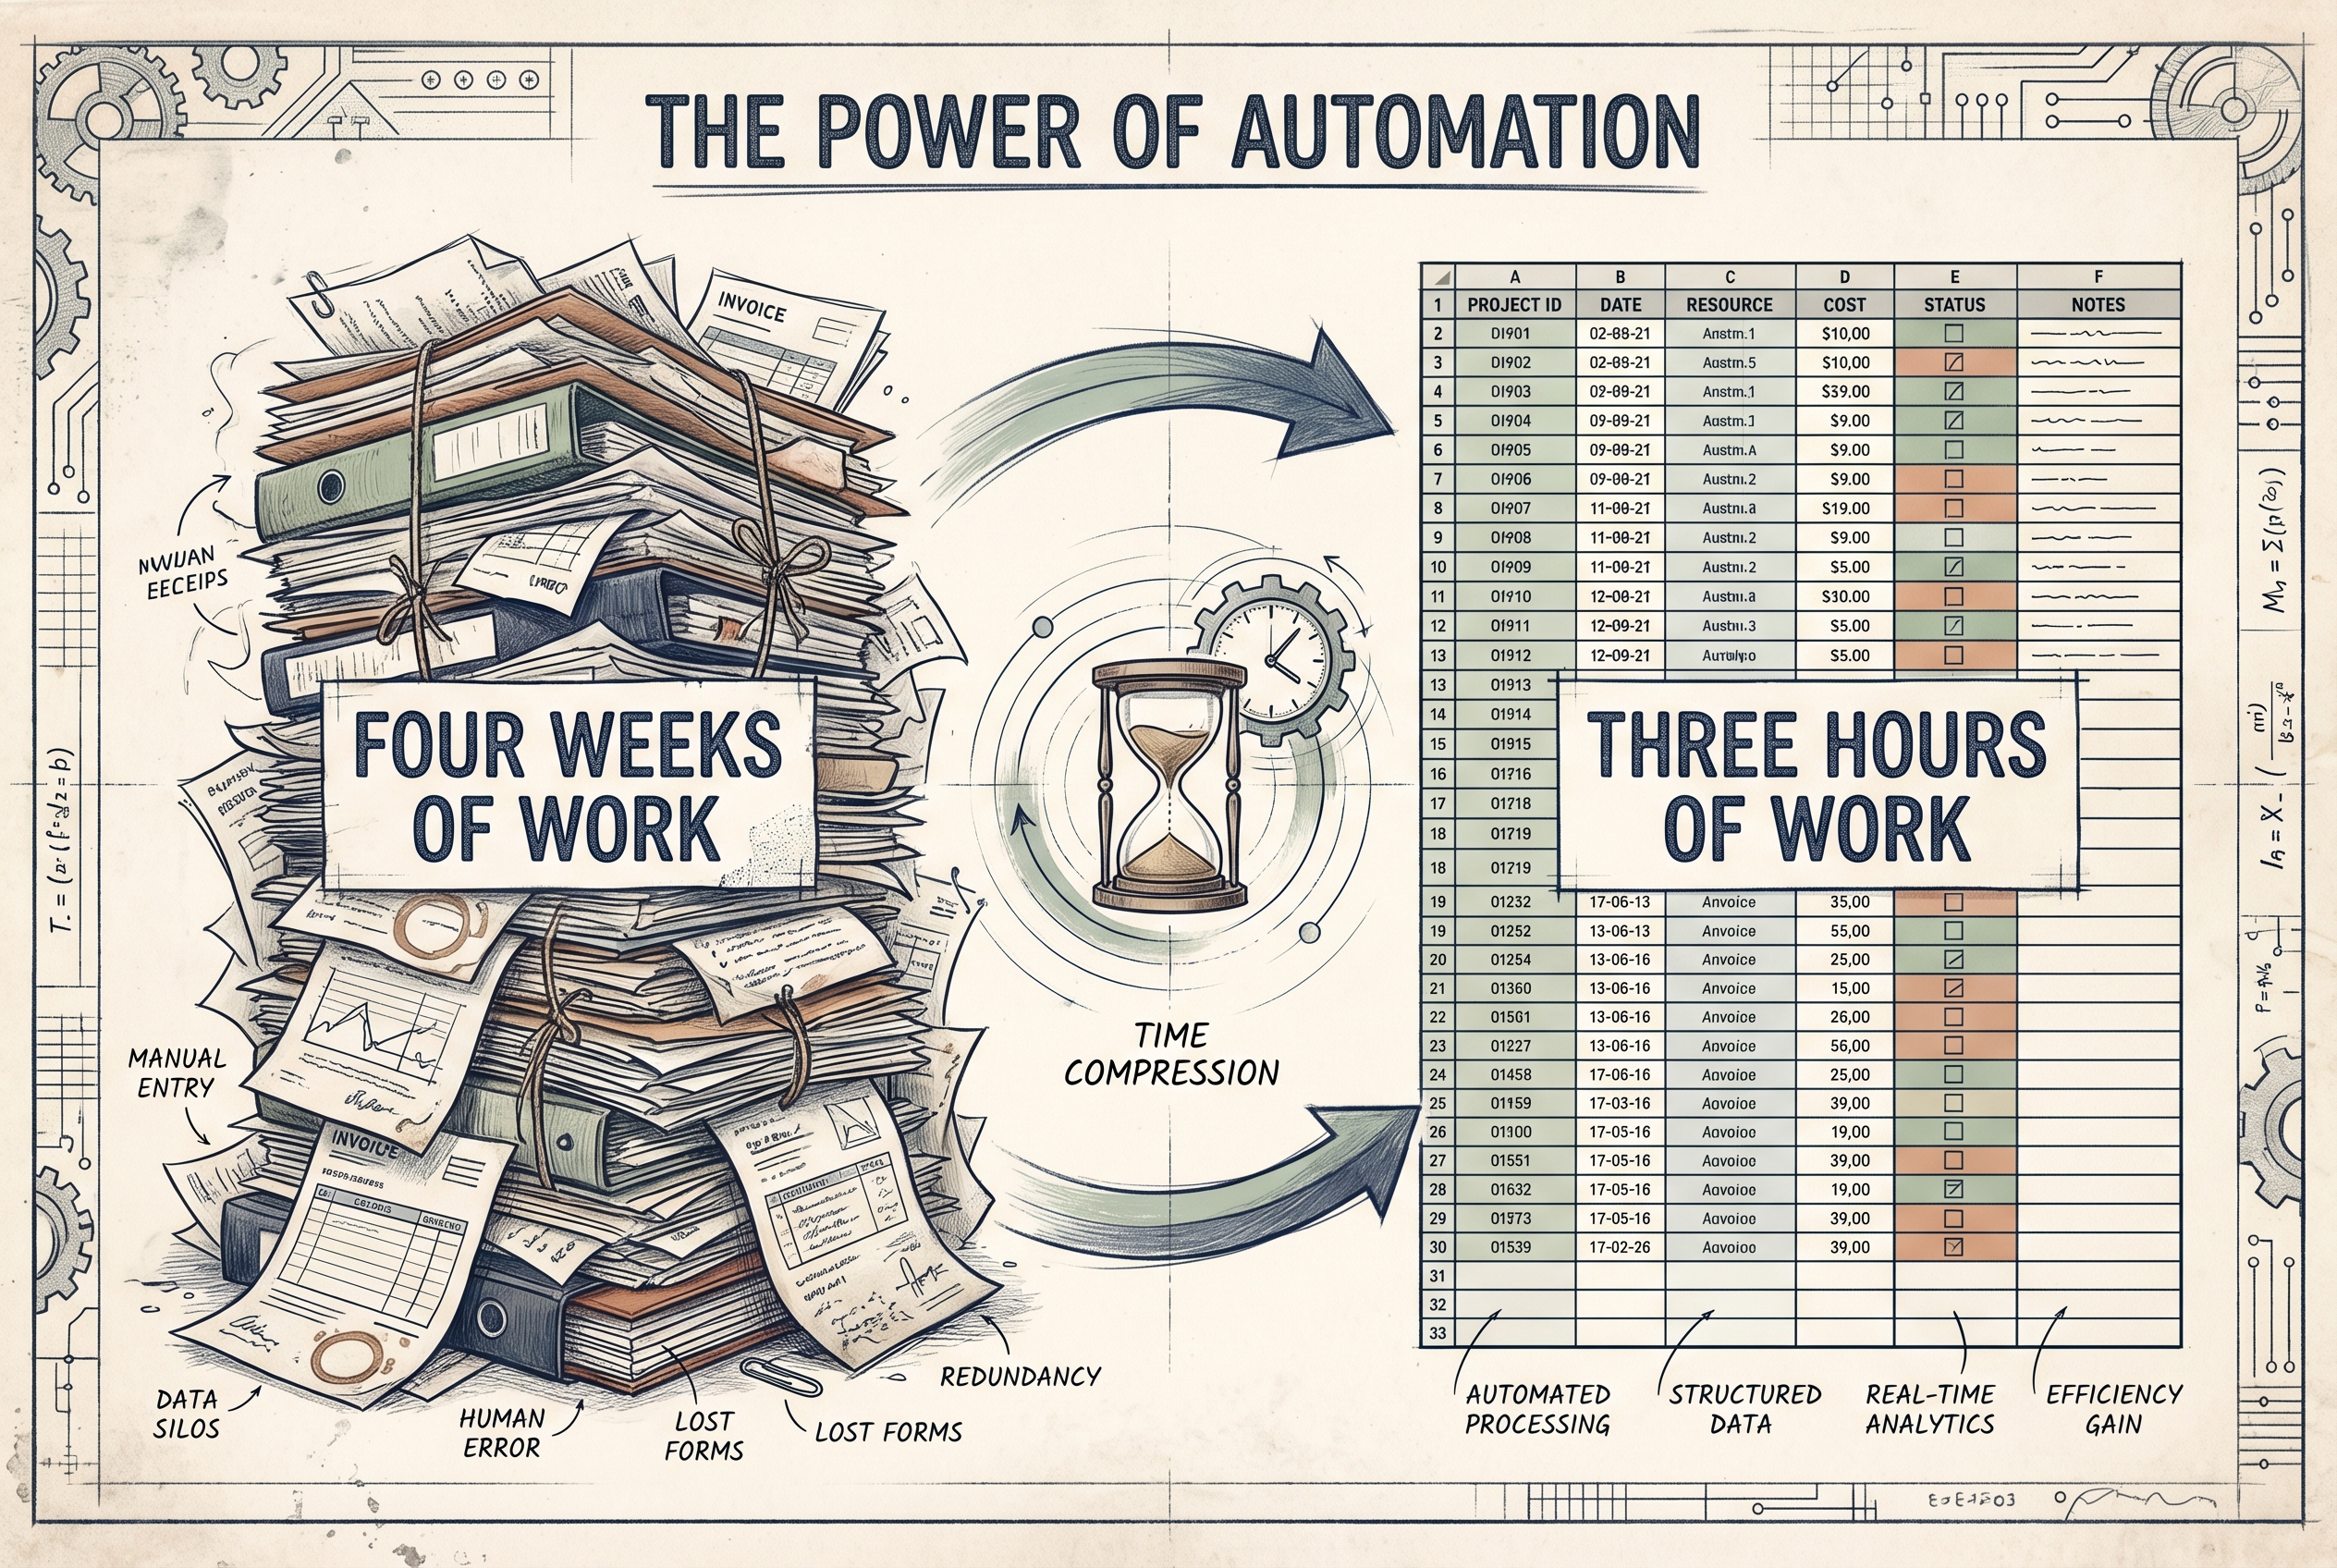
A month of work, three hours of work
Another e-commerce engagement where the messy input was data, not drawings.
Read the story →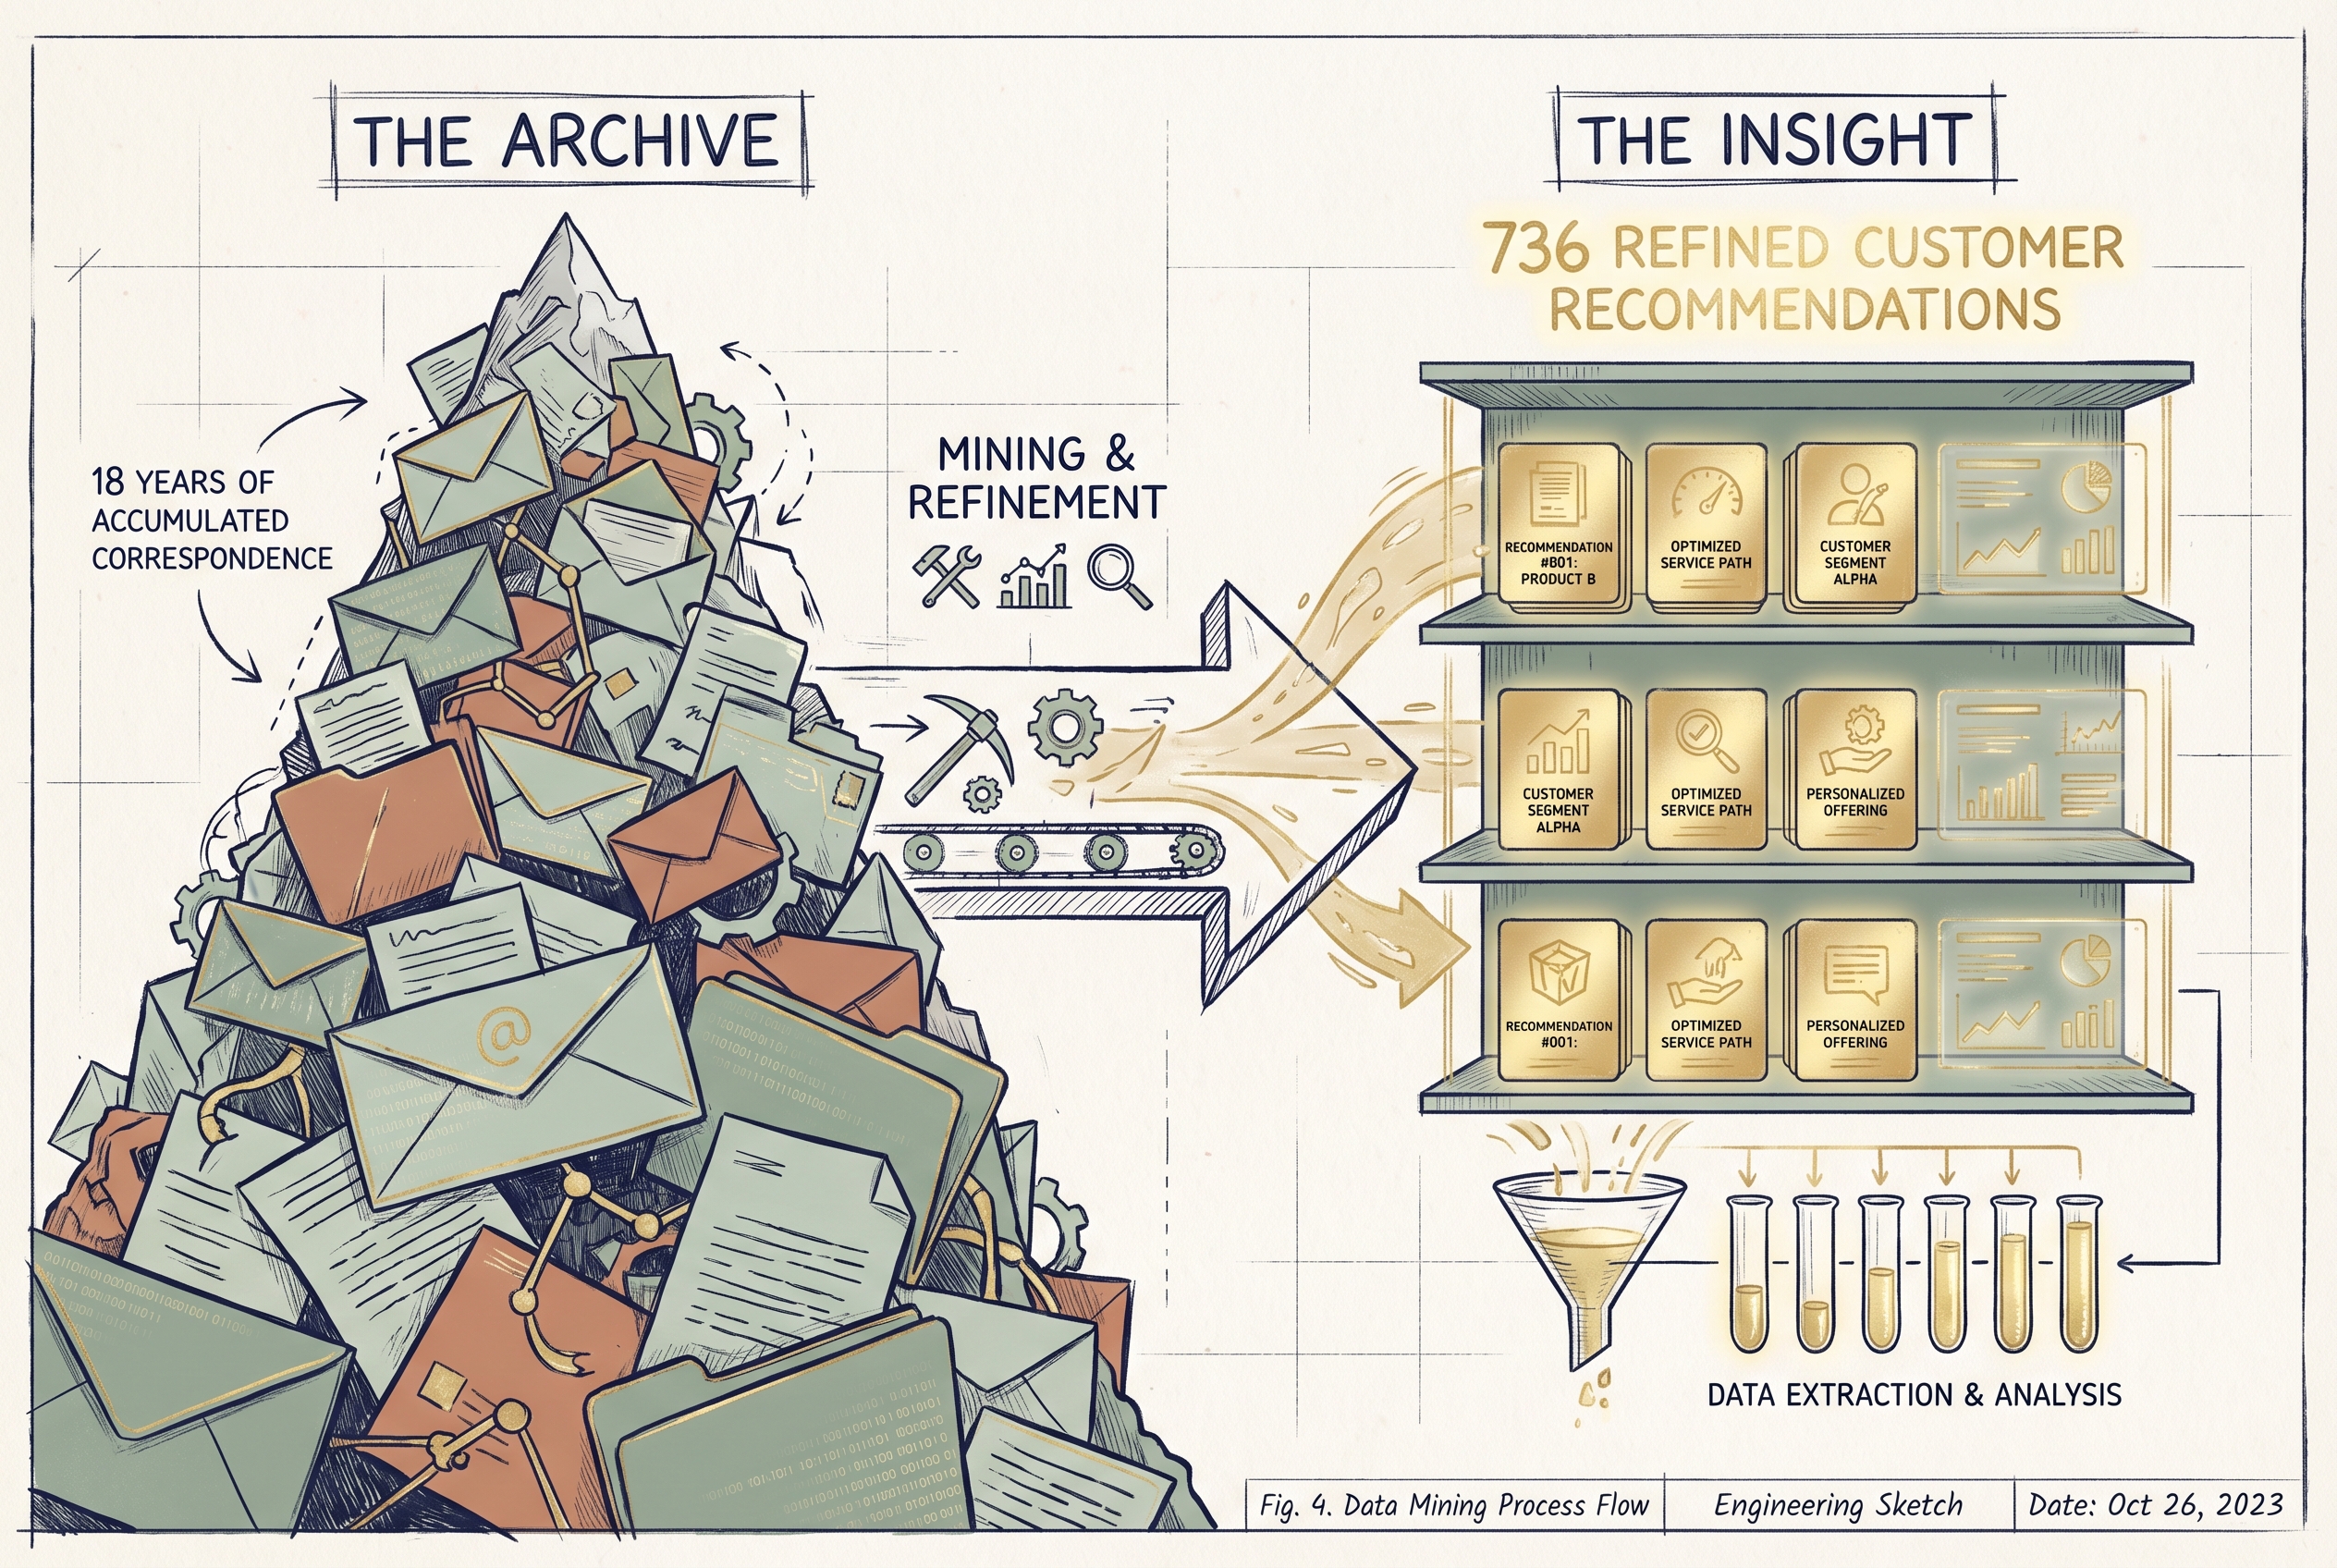
Eighteen years of email, turned into a pattern library
Another "structured recommendations out of messy input" story, in a different domain.
Read the story →
How I work
I work with my AI and the person who owns the business process — understand the context, select and adapt one of my existing protocols, deliver the results.
Read the page →